UpSet plot in Julia with Makie
UpSet plots are a data visualization method that is used to show multiple intersecting sets. Conceptually, they provide similar information as a Venn diagram, but can be easier to comprehend when the number of sets is higher. Additionally, they provide the ability to show additional attributes of the sets. Here we'll implement a simple UpSet plot in Julia using Makie.
We'll use CairoMakie, which can be used to render plots as SVG or PNG images. Additionally, we'll use the Combinatorics package to get all possible combinations of the provided sets. First, make sure you have the necessary dependencies installed:
using Pkg
Pkg.add("CairoMakie")
Pkg.add("Combinatorics")
Then we can add the packages to our namespace:
using CairoMakie
using Combinatorics
The data for UpSet plots can come in various ways. Our function will use the following format as its main input:
# The keys of the dictionary represent the combinations of
# the sets we want to visualize and the values are the number
# of elements common to all sets of the corresponding key.
data = Dict(
["a"] => 100,
["b"] => 93,
["c"] => 123,
["a", "b"] => 27,
["a", "c"] => 33,
["b", "c"] => 11,
["a", "b", "c"] => 3
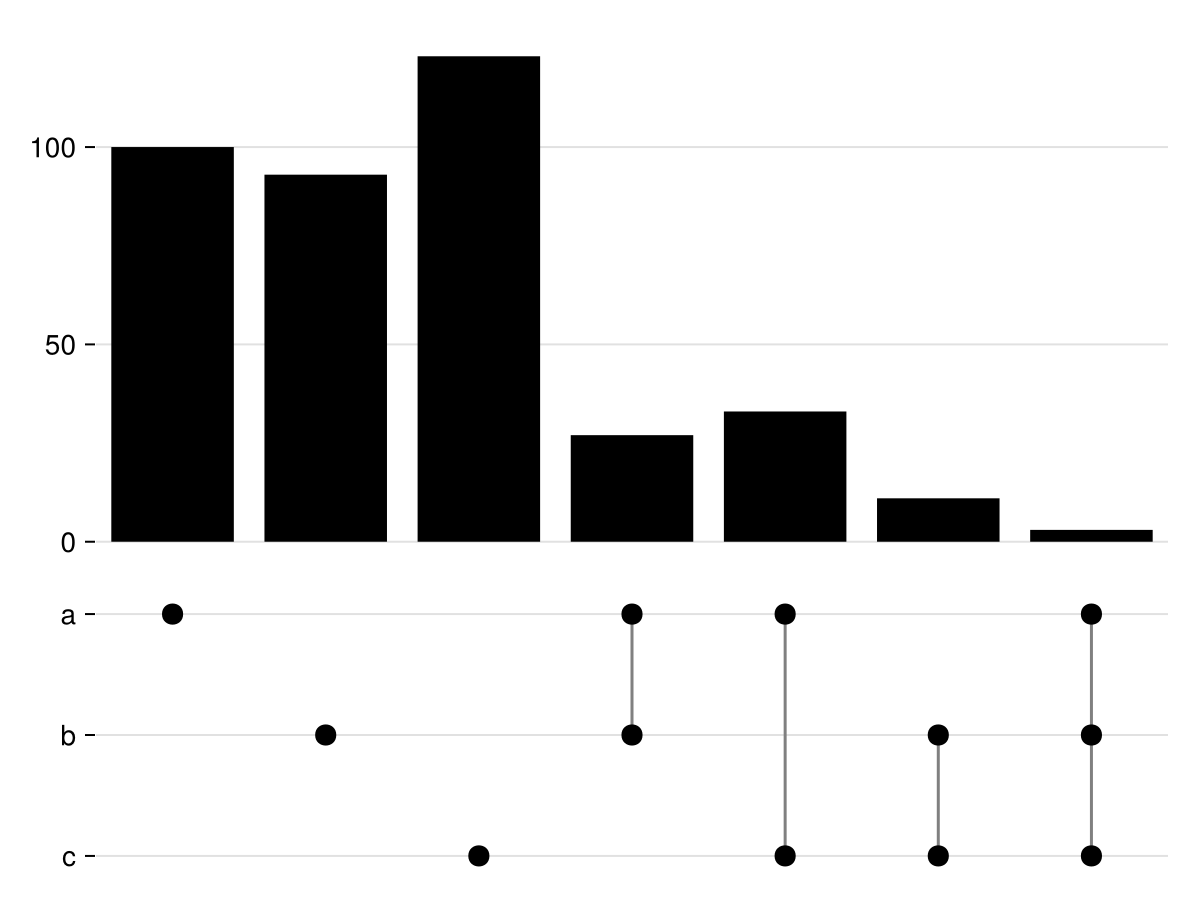
)For example, in the data above we have indicated that we have 100 elements in set a and 93 in set b, while the intersection between them contains 27 elements.
We also will provide a vector of the base sets to the function, so that we can control the order in which they're shown:
order = ["a", "b", "c"]Then, a basic UpSet plot can be accomplished with a function such as this one:
function upset(data, order)
  fig = Figure()

  num_sets = length(order)

  # top is the barplot part of the UpSet.
  # bottom is the part that shows the set intersections.
  # We reverse the given order, because we want the
  # first given set to be at the top (highest y-value).
  top = Axis(fig[1, 1])
  bottom = Axis(fig[2, 1],
                yticks = (1:num_sets, reverse(order)))

  # We get all possible combinations, not just
  # the ones that were given in the input data.
  combs = collect(combinations(order))
  num_combs = length(combs)
  comb_counts = map(c -> get(data, c, 0), combs)

  set_index = Dict(zip(order, 1:num_sets))

  barplot!(top, 1:num_combs, comb_counts, color=:black)

  for (i, comb) in enumerate(combs)
    # For each combination we get the row positions of the
    # top and bottom sets. We use this information to plot
    # lines that connect the dots that represent the sets.
    min_y = min(map(s -> set_index[s], comb)...)
    max_y = max(map(s -> set_index[s], comb)...)
    lines!(bottom, [i, i], [num_sets - min_y + 1, num_sets - max_y + 1], color=:gray)
    # We plot as large dots all the sets in the current combination.
    for set in comb
      scatter!(bottom, i, num_sets - set_index[set] + 1, markersize=15, color=:black)
    end
  end

  xlims!(top, 0.5, num_combs+0.5)
  xlims!(bottom, 0.5, num_combs+0.5)

  hidexdecorations!(top)
  hidexdecorations!(bottom)

  linkxaxes!(top, bottom)
  hidespines!(top)
  hidespines!(bottom)

  # This controls the relative height of the two rows.
  # This would make a fine additional parameter for our
  # function so that we can easily tweak it, depending
  # on the number of sets we want to plot.
  rowsize!(fig.layout, 1, Relative(2/3))
  rowsize!(fig.layout, 2, Relative(1/3))

  fig
end
Now, we can run the function and obtain an UpSet plot:
fig = upset(data, order)
save("upset_plot.png", fig)
Which produces the following plot: